


Have you ever wondered how businesses are able to deliver goods and services consistently to their customers? The magic lies in their business processes which are essentially a set of well-defined steps that work together to achieve a specific goal. Businesses document these steps in a Standard Operating Procedure (SOP), which acts as a guide for team members to replicate the process consistently. While traditional businesses relied on manual execution of these processes, modern day businesses embrace automation.
This is where hyperautomation comes into play. This strategic approach involves identifying repetitive tasks and employing various automation tools, like software bots, to streamline them. Hyperautomation also helps improve the process of business process monitoring, providing valuable insights for further optimisation and ensuring smooth, consistent operations.
By continuously monitoring business processes, you can analyze performance, address potential issues, and make informed decisions about process improvements. In the process automation world, automation execution related key metadata (like logs, metrics, events and traces) that is recorded and transmitted for analysis is called as telemetry. Telemetry data collected from these automation is an indispensable asset. Insights from telemetry helps businesses extract actionable information for forecasting future needs. This blog will explore key process automation insights which can be deduced by predictive analytics and try to identify the apt model for achieving this.
Understanding Predictive Analytics
Predictive analytics is a branch of data analytics that foresees future outcomes of events based on historical data, information, and facts. Predictive analytic techniques can identify the patterns in data to recognise anomalies, trends or forecast future probable outcomes.
Which Process Automation analytics can be deducted using Predictive Analytics
Trend and forecast analysis are very important for modern-day businesses. In the process automation domain, understanding trends and forecasting key business metrics such as volume processed, productivity hours gained, bot runtime, and automation success percentage is crucial for making key business decisions.
For instance, analysing the volume processed helps understand seasonal trends in business data and identify deviations (anomalies). Similarly, forecasting productivity hours gained, helps businesses in workforce planning and optimisation. In nutshell, predictive analytics helps organizations with capacity planning, goal setting, and anomaly detection.
Case Study
Documenting below the findings from a case study related to a process automation in e-commerce domain. The business process involves fetching inventory data from different sources and corresponding PO (purchase order) status. This data is further shared with downstream team for managing stock availability for vendors\suppliers.
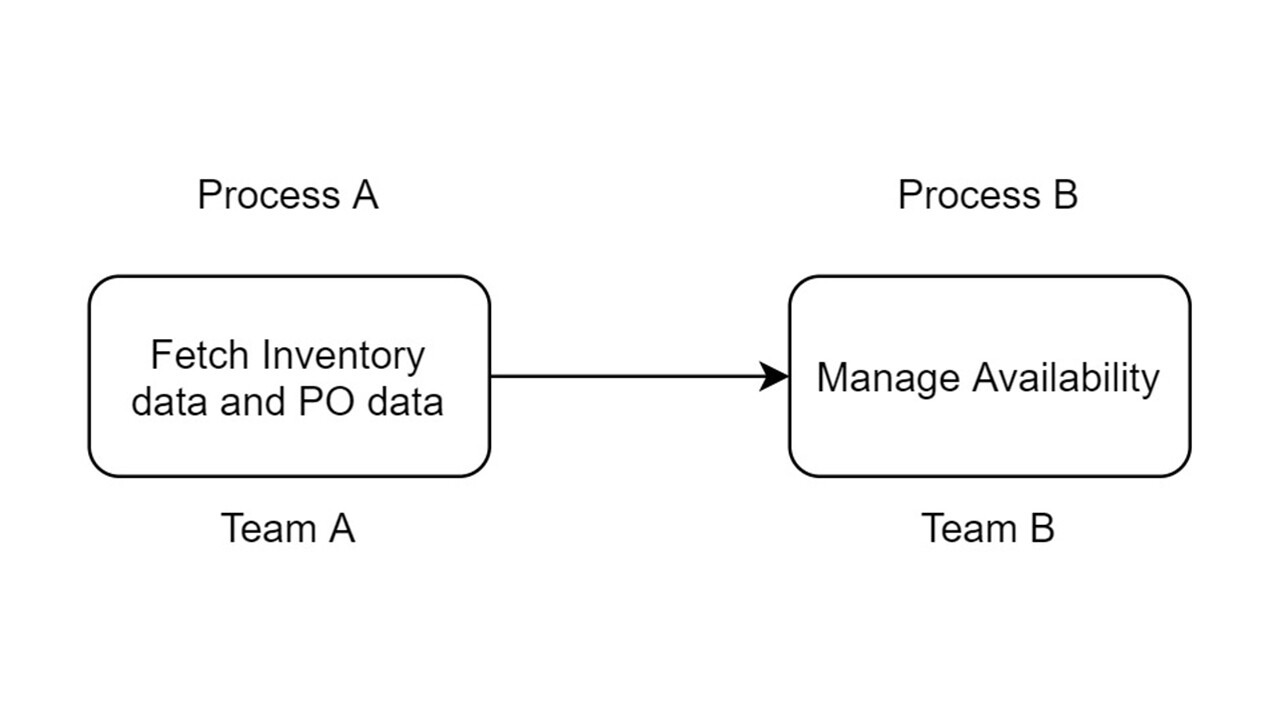
As shown in figure, we had two business processes A and B. While team A would focus on gathering the data, team B would focus on using this data to make decisions related to inventory availability management. We automated the process A, however the process B was manual as it involves human decision making. However both teams were interested in below key insights:
- As the workload was not uniform, and the downstream process (process B) was manual, downstream team (team B) wanted to predict the peaks and lows to ensure apt resourcing so as to maintain the SLA (service level agreement).
- Stakeholders in Team A were interested in key trends such as automation utilization, time saved, and money saved. For instance, processes change over time, with more variations and nuances being added. Therefore, a decline in the trend of automation utilization (volume processed) would prompt stakeholders to further evaluate the existing automation for potential improvement opportunities.
In a nutshell, we needed to identify average trend and also forecast values for given future time period. Using the telemetry data derived from the process automation, we performed experiments with different descriptive and predictive analytic models.
Experiment
The process automation telemetry under purview, had important fields like “volume processed”, “automation name”, “username”, “time stamp” etc.. This process automation was executed by ~150 users daily.
Telemetry data set analysis
Post diving deep into the telemetry data, we were able to infer that it is time series data. Time series is a series of data points indexed (or listed or graphed) in time order. Hence we need a time series algorithm for identifying trendlines and forecasting.
Before moving to identifying the right algorithm, lets understand basic components of a time series type of an analytic problem.
Before moving to identifying the right algorithm, lets understand basic components of a time series type of an analytic problem.
- Trend: It is a long-term movement of the time series, example: decreasing average heart rate of workouts as a person gets fitter.
- Seasonality: Regular periodic occurrences within a time interval smaller than a year (e.g., higher step count in spring and autumn because it’s not too cold or too hot for long walks).
- Periodicity: repeated fluctuations around the trend that are longer in duration than irregularities but shorter than what would constitute a trend. In our walking example, this would be a one-week sightseeing holiday every four to five months.
- Irregularity: short-term irregular fluctuations or noise, such as a gap in the sampling of the pedometer or an active team-building day during the workweek.
Technical Requirements for algorithm choice
While choosing the algorithm, we had two main considerations:
- We were looking for an algorithm which can handle business seasonality as business processes would have them inherently.
- The log data size was in 20-100 KB range, hence we wanted to avoid computational complexity of neural network algorithms.
| Dimension | ARIMA | PROPHET | |
| Requirements | Input data needs to be cleaned to meet | stationarity | Data cleaning not required |
| Tuning | Tuning is easy and automatic. | Domain knowledge is required to tune prophet | |
| Missing data | Poor handling of missing data because of lagged signals | Capable of handling missing data | |
| Changes | Not possible to pass changepoints | Functionality to pass changepoints | |
| Business Seasonality | Not possible to capture seasonality with presense of holidays | Functioanlity to handle holidays, weekends etc. |
- It provides flexibility to handle missing data points. Our data-set analysis, identified cases where automations might not be run by users for known reasons like process changes, time-off, etc.. Prophet can handle such variations with ease. Whereas models like ARIMA depend on lagged data points and hence handling of missing data points is not possible.
- Process automation telemetry dataset can change based on time-series. For example: process volume changed QoQ/YoY. By default, Prophet will automatically detect these change-points and will allow the trend to adapt appropriately. Provision for accepting change-points makes Prophet well suited for our use-case over simple models like exponential moving averages etc.
- Our use cases follow business cycles. For example, the business process under discussion was executed on weekdays and not on weekend. Prophet is built to handle business considerations like this.
Experiment outcome with Prophet
1. Forecasting volume processed by automation
We feed the production data set through Prophet model, hosted on a AWS SageMaker instance. In this case-study we focused on commonly used attribute in process automation: “Count of volume processed” i.e. number of inventory items processed. Below is the prediction plot (volume processed: i.e. number of units processed vs time). Looking at historical data for eight months we predicted count for the next one month. Below graph shows the performance of this prediction exercise.
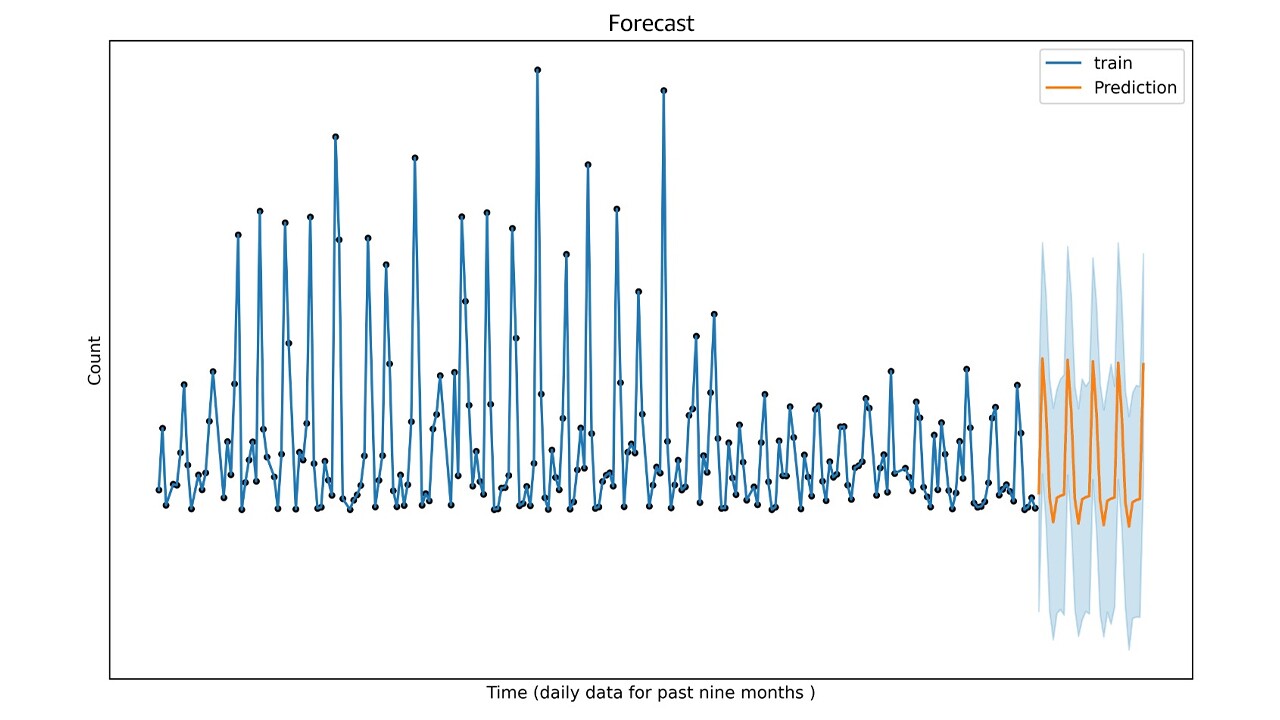 Fig 1. Forecast Graph: X axis - Time, Y axis - count of volume processed
Inference: The predicted ASINs are captured accurately in the 95% confidence interval for 96% times in the one month of prediction window. This data will help the business team predict automation ROI, dollar savings for upcoming months.
2. Trendlines for volume processed by automation
We plotted the month over month average data on volume processed by automation (blue line) and the estimated downstream team’s resourcing capacity to manually execute the process (red line). The black line indicates the actual resourcing capacity spend by the downstream team.
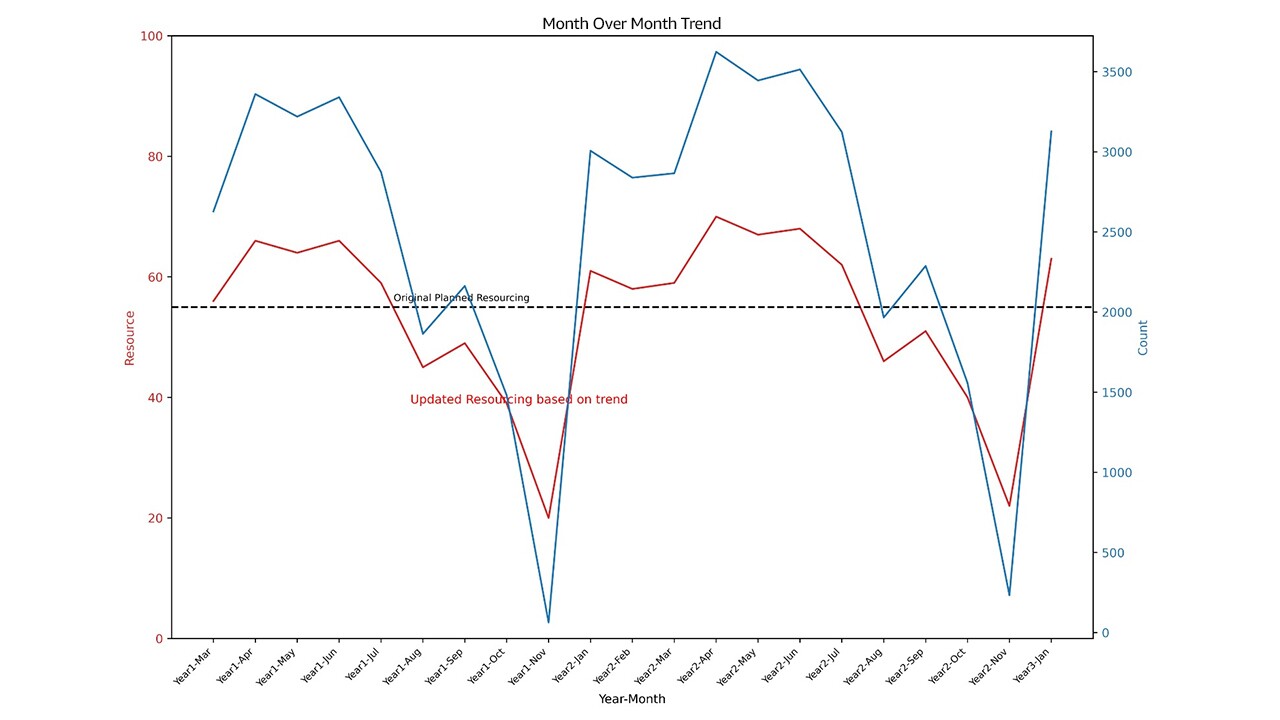 Fig 2. Month over Month average trend along with resources deployed
Inference:
One of the critical aspects of business planning is to derive insights based on historic patterns and trendlines.
Identifying the pattern/cycles
In this case study we can use descriptive statistics of the process to plan resources at macro level.
Above example graph which shows month over month trendline of the average volume processed by automation. In absence of such insights, the downstream business team spends fixed/constant resourcing to execute the downstream process (B). However now with these insights, downstream team can identify the cyclic pattern of high volume in first half of the year gradually decreasing in the second half and plan resources in optimized manner responding to dynamic changes over the year.
Pain Points
Earlier in absence of predictive analytics, business had significant challenges and complexities in decision making process. Relying solely on intuition or traditional methods exposed them to inherent limitations and risks. Traditional decision-making approaches lack the agility and foresight required in today's rapidly evolving business environment. The decisions made without the aid of predictive analytics are palpable. The absence of a forward-looking, analytical approach may result in poor resource allocation, flawed strategic planning, and an inability to adapt to changing dynamics.
Benefits
However now with predictive analytics, business teams were able to mitigate these risks. With automated short-term forecasting and historic trendlines, business teams were able to optimize the resourcing and maintain SLAs more accurately. Also they were able to predict automation ROI, dollar savings.
While we conducted this case study on volume processed attribute, we can apply same technique to predict other key parameters related to process automation like execution time, automation success and failure rates, manual hours saved etc..
While we conducted this case study on volume processed attribute, we can apply same technique to predict other key parameters related to process automation like execution time, automation success and failure rates, manual hours saved etc..
Conclusion
We discussed how predictive analytics can help in process automation domain. We also compared different time series analysis and prediction methods suitable for process automation domain.
Analytics offers multiple benefits for businesses in context of process automation like:
- Predict and monitor business impact, including time and money saved over time.
- To indicate the direction of a measure in a defined timeline (e.g., Robot/automation utilization, Job success rate, Money saved, Time saved).
- Trendlines can be used to identify cycles (peaks, lows). Trend analysis helps businesses anticipate changes in the market and make informed decisions about how to respond to those changes.
While earlier there was no mechanism to forecast metrics and identify anomalies from trendlines, this analysis and implementation helped us achieve these to help business teams. Now we were able to get real-time visualization on trendlines, configure alarms for anomalies and also be able to forecast for given time period. There is no universal algorithm that is suitable for all problems. The selection of the appropriate algorithm is dependent on factors such as the input data set, the availability of a training set, and the use-case domain. In context of Process Automation using prophet algorithm we were able to successfully achieve accurate predictive analytics.
DISCLAIMER:The views expressed in this blog are solely those of the author and do not represent the views of Amazon. The information presented in this blog is for informational and educational purposes only. The author provides no guarantees or warranties regarding the accuracy, completeness, or usefulness of any content. Users acknowledge that any reliance on material in this blog is at their own risk. Amazon does not endorse any third party products, services, or content linked from this blog. Any links or reference to third party sites or products are provided for convenience only. Amazon is not responsible for the content, products, or practices of any third party site. The author reserves the right to make changes to this blog and its content at any time without notice. This blog may contain the author's personal opinions, which do not necessarily reflect those of Amazon.