

Over the recent years, the digital devices market in India has witnessed a dynamic shift in consumer behaviour, triggering a mobile revolution. Widespread availability of pocket-friendly smartphones and affordable mobile data services saw individuals gravitating away from desktop computers to mobile devices. As mobile devices became more popular, there is a growing demand for high-performing mobile apps that provide a seamless user experience. Today, the bar is so high that the success of a mobile application lies in its overall performance. This article will discuss about different tools used by engineers for mobile application performance testing during the testing and development stages of an application.
Performance Testing: Background
Mobile performance testing is the process of evaluating and measuring the performance characteristics of an application. This includes the time taken for the application to start or load a page, its responsiveness to user actions, and its ability to handle increased user load. The goal is to ensure that it meets the desired performance standards and delivers a smooth and responsive user experience. This blog will focus on aspects like CPU usage, network diagnostics, and memory profiling, all of which directly impact application performance and battery life of the mobile device.
Mobile performance testing is typically conducted using specialized tools and frameworks that simulate various scenarios, network conditions, and device configurations. The results of these tests helps us identify performance bottlenecks, optimise code and resources, and improve the overall performance of the mobile application.
Performance Measuring Tools and Criteria
Android Profiler and Xcode instruments will be the two profiling tools that will be discussed in this blog. While Android Profiler is an inbuilt feature within Android Studio, Xcode instruments is a feature in Xcode Applications for IOS.
To begin with, we need to confirm the expected performance threshold of the newly launched application either from business team or by comparing performance against an existing benchmark application. To ensure accurate results, it is important to perform similar actions on the applications under comparison for the same amount of time (say 15 secs) and analyse the results. It is also crucial to use the same device and network connection when measuring CPU usage, memory usage, and network usage of the applications. By understanding these metrics, we can optimise the performance of the application under test and reduce battery consumption.
Before initiating the performance testing we need to ensure we are using pre-production debug builds for the newly launched application and stable benchmark application. Debug builds contain additional debugging information, which allows the Profiler to gather more detailed performance data, memory allocation tracking, and real-time CPU usage analysis.
Before initiating the performance testing we need to ensure we are using pre-production debug builds for the newly launched application and stable benchmark application. Debug builds contain additional debugging information, which allows the Profiler to gather more detailed performance data, memory allocation tracking, and real-time CPU usage analysis.
Android Profiler
Android Profiler is a feature within the Android Studio application which can be downloaded here. It offers an array of built-in tools designed to analyze the application performance. These tools enable engineers to pinpoint performance bottlenecks, scrutinize battery consumption, and uncover memory leaks in the mobile application. Android profiler supports both java and native code and facilitates profiling on both simulator and real devices. For getting started with the profiler, Android studio should be installed (steps) in Engineer’s laptop / Desktop and Android Phone should be connected to the laptop/Desktop.
Sample Application under Test
We recently launched a mobile application for a feature which was already existing on desktop and wanted to do performance testing before launching the application to the end users. For setting the threshold, we compared the results of performance parameters of the application with that of an already existing in-house benchmark mobile application and analyse the results. For testing performance on the Android mobile application we used Android profiler. It comes with three main tools-
- CPU Profiler
- Memory Profiler
- Network Inspection Profiler
CPU Profiler: CPU Profiler is used to inspect application CPU usage and thread activity in real-time while interacting with the application. The CPU usage chart shows the percentage of CPU usage over time, and checks for spikes or areas of high usage as these can indicate areas of our application that are causing performance issues. The CPU usage is broken down into three main categories: App, Thread and Others. By understanding the CPU usage of each of these categories, we can optimise the application performance and reduce battery consumption.
For our use case, we took 10 samples of CPU usage activity from newly launched application and the existing benchmark application. We performed actions on both the applications, like scrolling through pages, minimised, maximised the application, forced restart and closed the application. During verification we searched for any major spikes in CPU usage while performing these actions. This helped us in determining if the launched application’s CPU usage was breaching the threshold set by the benchmark mobile application.
For our use case, we took 10 samples of CPU usage activity from newly launched application and the existing benchmark application. We performed actions on both the applications, like scrolling through pages, minimised, maximised the application, forced restart and closed the application. During verification we searched for any major spikes in CPU usage while performing these actions. This helped us in determining if the launched application’s CPU usage was breaching the threshold set by the benchmark mobile application.
CPU Usage (Newly Launched Application)
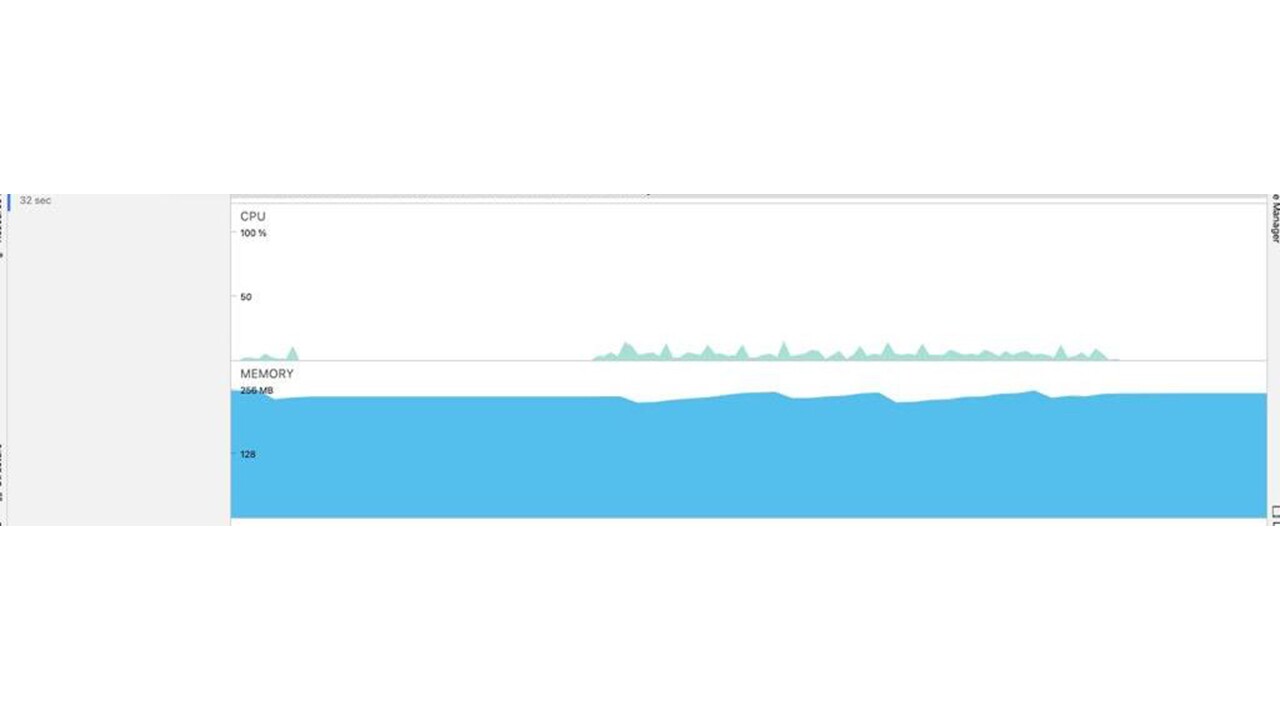
In the above picture, we can analyse application's CPU usage and thread activity by clicking anywhere in the CPU timeline.
The CPU profiler keeps on recording the activity of the application and the user can view the recording during debugging the issues.
In the table below, we have recorded the CPU usage at different times in the application while performing actions on the applications. While analysing the results we did not see a major spike in CPU usage across the applications.
| Newly Launched Mobile Application | 5 | 14 | 113 | Benchmark Mobile Application | 5 | 21 | 157 |
| 6 | 7 | 113 | 8 | 35 | 159 | ||
| 7 | 7 | 113 | 3 | 24 | 153 | ||
| 4 | 14 | 113 | 5 | 20 | 153 | ||
| 6 | 8 | 112 | 5 | 27 | 150 | ||
| 5 | 9 | 112 | 4 | 13 | 149 | ||
| 15 | 11 | 112 | 7 | 19 | 149 | ||
| 14 | 4 | 112 | 6 | 22 | 149 | ||
| 9 | 16 | 112 | 14 | 11 | 148 | ||
| 13 | 6 | 112 | 14 | 16 | 149 | ||
| Total | 84 | 96 | 1124 | Total | 71 | 208 | 1516 |
| Avg | 8.4 | 9.6 | 112.4 | Avg | 7.1 | 20.8 | 151.6 |
Memory Profiler:
In order to ensure that the mobile application runs smoothly and does not cause any performance problems or memory leaks, it is important to profile its memory usage. Memory Profiler is used to identify memory leaks and memory churn that can lead to stutter, freezes, and even application crashes. It shows a real-time graph of our application’s memory usage and helps us capture a heap dump, force garbage collections, and track memory allocations. It can help us optimize our application’s memory usage and ensure that it runs smoothly on different devices. We can Record memory allocations during normal and extreme user interaction to identify exactly where the code is either allocating too many objects in a short time or allocating objects that become leaked. In our application, we verified the memory consumption by capturing memory consumed at different times while performing actions on the application. For our application we did not see any undesirable memory allocation patterns in the timeline that might cause performance problems. Both applications displayed similar usage patterns in terms of memory utilization, with no significant increases observed. In the table below we have recorded the memory consumption captured in the memory profiler of the application.
Memory profiler data table
| Newly Launched Mobile Application | Memory (mb) | Benchmark Mobile Application | Memory (mb) |
| 196.1 | 194.3 | ||
| 195.8 | 202.5 | ||
| 197.8 | 208 | ||
| 198.5 | 210.9 | ||
| 199.2 | 207.8 | ||
| 200 | 200.9 | ||
| 201.3 | 204.6 | ||
| 203.3 | 206 | ||
| 208 | 209.7 | ||
| 209.9 | 201.1 | ||
| Total | 2009.9 | Total | 2045 |
| Avg | 200.9 | Avg | 204.5 |
Android profiler comes with Network Inspector feature which helps to identify bottlenecks and other issues that could be slowing down data transfer for Mobile Applications. Network Inspector allows development / test engineers to visualize network activity on a timeline, giving real-time insight into how and when the Mobile application transfers data. It provides information such as the number of requests, total data transferred, and average response time for each network call. This information helps us in identifying and troubleshooting performance bottlenecks, as well as optimise network usage to reduce data usage and improve the user experience.
Network Inspector provides a detailed overview of the network activity, including data sent and received.
With the Network Inspector, we can track our application’s network requests and responses, including details such as headers, payloads, and response codes. The below table displays the network call made by our application and the response time for each call.
With the Network Inspector, we can track our application’s network requests and responses, including details such as headers, payloads, and response codes. The below table displays the network call made by our application and the response time for each call.
| Newly Launched Mobile Application | Size (kb) | Time (ms) | Benchmark Mobile Application | Size (kb) | Time (ms) |
| getABC | 14.3 | 720 | getXYZ | 16.7 | 820 |
| 14.3 | 656 | 16.7 | 810 | ||
| 14.3 | 679 | 16.7 | 795 | ||
| 14.3 | 555 | 16.7 | 786 | ||
| 14.3 | 579 | 16.7 | 780 | ||
| 14.3 | 569 | 16.7 | 783 | ||
| 14.3 | 578 | 16.7 | 766 | ||
| 14.3 | 566 | 16.7 | 777 | ||
| 14.3 | 597 | 16.7 | 750 | ||
| 14.3 | 503 | 16.7 | 763 | ||
| 14.3 | 513 | 16.7 | 740 | ||
| 14.3 | 575 | 16.7 | 730 | ||
| Total | 143 | Total | 167 | ||
| Avg | 14.3 | Avg | 16.7 |
Xcode Instruments for IOS Mobile Application
Xcode Instruments is a feature in Xcode Application (Link for downloading)under open developer tool option for mobile application testing on iOS. It provides set of performance and debugging tools that help in identifying performance bottlenecks and bugs in applications such as CPU Profilers, Time Profiler, Memory Leaks.
We followed similar strategy for doing performance testing on IOS and did a comparison of results between two aaplications.
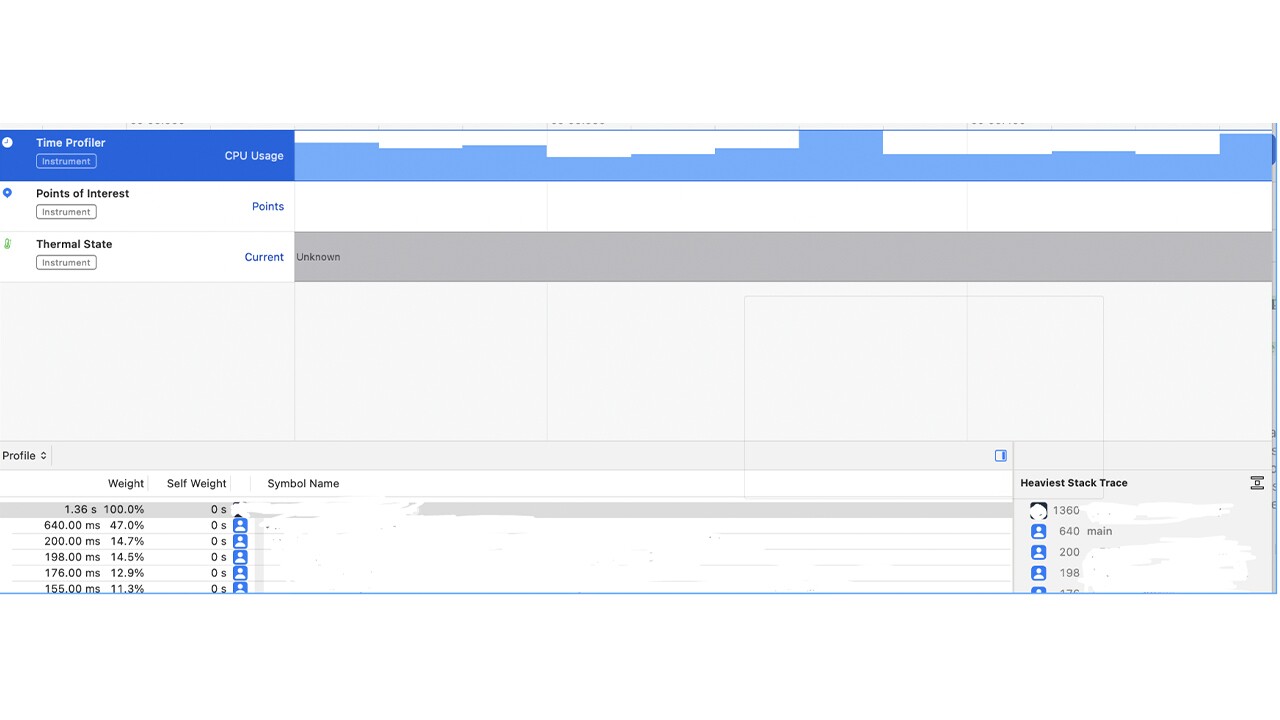
Time Profiler
The Time Profiler tool helps in identifying the areas of the application that are taking up too much CPU time. It helps in measuring the performance of an application by recording and analysing the amount of time spent on each method and function call during execution.
In the Time Profiler we begin with selecting the sample application in the Xcode intruments. Once the application is selected in the upper pane we record the performance on the Time profiler. While recording we need to perform actions on the application like scrolling through pages, upload, download sheets, close, minimise the application.
Once we have recorded we need to stop and analyse the results. The results are displayed in the form of a call tree displaying the heaviest stack trace and the weight of the each call made by function in the application.The weight is expressed as a time and a percentage. The weight measures the amount of time the function was on the call stack. The self weight measures the amount of time the function was at the top of the call stack. For our application we did not notice any major increase in the stack trace or the weight of the application. Our application portrayed 1360 in Stack trace while as benchmark application displayed 1500. The main thread was taking only 640.00ms out of total of 1.36 sec for our application which was not much.
| Newly Launched Mobile Application | Weight | Self Weight | Symbol Name | Heaviest Stack Trace | Benchmark Mobile Application | Weight | Self Weight | Symbol Name | Heaviest Stack Trace |
| 1.36 s 100% | 0 s | Function A | 1360 | 7.62 s 100% | 0 s | Function X | 7619 | ||
| 640.00ms 47% | 0 s | Function B | 640 | 4.59 s 60.2% | 0 s | Function Y | 4594 | ||
| 200ms 14.7% | 0 s | Function C | 200 | 337ms 4.4% | 0 s | Function Z | 3536 | ||
| 198ms 14.5% | 0 s | Function D | 198 | 314ms 4.1% | 0 s | Function P | 3536 | ||
| 176ms. 12.9% | 0 s | Function E | 176 | 285ms. 3.7% | 0 s | Function Q | 3227 |
Time Profiler(Newly Launched Mobile Application)
CPU Usage
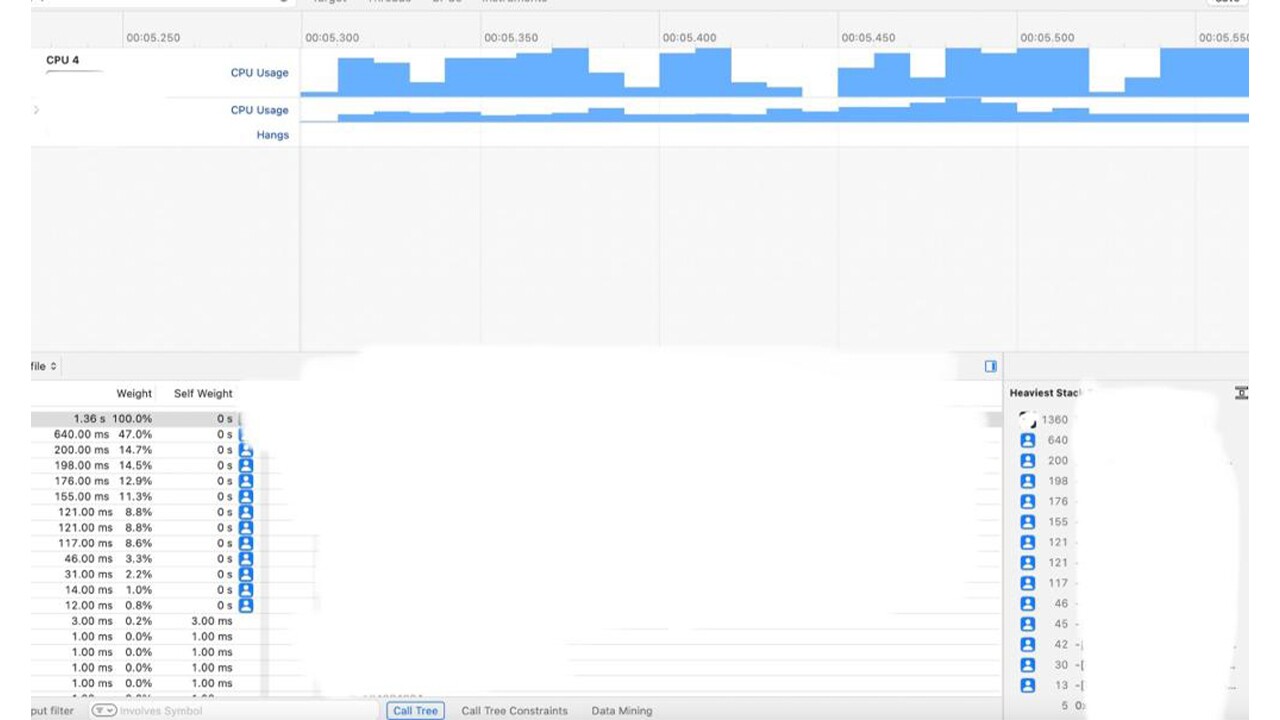
The CPU Usage instrument in Xcode is used to monitor the percentage of CPU usage for an application or process. It displays a graph of the CPU usage over time, allowing user to identify periods of high or low CPU usage. On selecting CPU profiler in the Xcode instruments we land on the UI which displays the CPU usage for our application. We record the CPU usage for 15-20 secs and anlayse the recording . Once we hover over the recording, tooltip appears showing you the percentage of CPU usage for that core at that moment in the recording. We recorded usage ranging from 191 - 250 % in our application similar to the benchmark mobile application(210- 190%).
CPU Usage(Newly Launched Mobile Application)
Memory Leaks
The Energy Diagnostics tool helps in identifying the parts of application that are contributing to increased battery consumption. This tool can be used to optimise battery usage and improve the overall performance of the application.
It includes information on memory leaks visible in the application. For our application everything was green and no memory leaks were visible on the UI.
It includes information on memory leaks visible in the application. For our application everything was green and no memory leaks were visible on the UI.
Network Diagnostics
The Network Diagnostics instrument in Xcode is used to monitor the network activity of an application and identify network-related issues. It can help in diagnosing problems with network connections, such as slow response times, dropped packets, or connectivity issues.
The Network Diagnostics instrument works by monitoring the network activity of an application, including network requests and responses. It captures data such as request and response headers, payload sizes, and connection status. It also records network metrics such as latency, throughput, and error rates.
Summary
Performance testing can be done on the Pre-Production environment of the Application under test. The Application should have debug build installed which allows Android profiler and Xcode instruments tools to access the application. These tools can help in identifying specific areas where users might experience performance issues, such as slow navigation between screens or delays in loading data. The application should be tested under different loads, network conditions, and device configurations to ensure optimal performance across these scenarios. It is highly recommended to incorporate these tools into testing and optimization strategies to ensure that applications meet performance standards and function seamlessly for users.
DISCLAIMER: The information in this article about software testing techniques and best practices is provided for general educational purposes only. The author is not an attorney and this article does not constitute legal advice. Readers should consult an attorney if they need legal advice about software testing or any other topic covered in this article. The author and publisher disclaim any liability arising from reliance on the information contained herein. The software/ tools and brand names mentioned in this article are trademarks or registered trademarks of their respective owner entities. The author is not affiliated with or sponsored by any of the third party software owners mentioned. The reference to third party software is for informational purposes only and does not constitute an endorsement or recommendation.